Introduction
I recently saw this tweet:
Measuring performance by CPL instead of rating or result is a revelation! I’ve lost games to strong players where I have played well (low CPL), and beaten weaker players and played badly (high CPL). Should help see through the result / rating change to your true performance. pic.twitter.com/OwK146NI9k
— Pascoe Rapacci (@prapacci) January 13, 2022
I’ve been trying to figure out a way to measure progress. My rating does not seem to show much change over the last six months. But what if I measured my average centipawn loss per game?
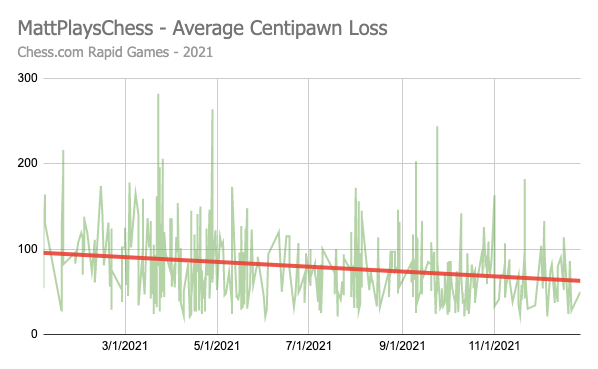
I thought I would check all my games for 2021 and see how I improved. To cut to the chase, it looks like I’m doing better:

Centipawn Loss
Instead of coming up with my own definition, I’ll use this one from chessquestions.com:
A centipawn is 100/1th of a single pawn and centipawn loss is a calculation and numerical score given by a chess engine to the difference between the move you actually play against the strongest move available at that time. A GM may score Average CPL of under 20, a new chess player, 150!
Step 1 - Getting All My Games
To start with, I needed to get all of my games. My goal was to not have to manually go over every game, because there were over 600 in 2021!
I primarily play on Chess.com and they do not use average centipawn loss. Instead they use an “accuracy” rating. In most of my games I checked the accuracy, but not all. I think I could use the API to go through each game and check the accuracy, but I really wanted the centipawn loss value. That is available on Lichess, so I could add all my games from Chess.com there, but then I would have to analyze each one and I didn’t want to do that.
Instead, I thought I would first download all my games and calculate it locally. Chess.com has monthly archives of a player’s games (API reference), so I just got all of them for the year and then created a big PGN file.
Here is the script I used to download all my games from Chess.com. After I ran it, I had a large PGN file with all of my games.
import requests

user_name = '<add your username here>'

with open("all_games.pgn", "w") as output_file:
    for month_index in range(12):
        api = f"https://api.chess.com/pub/player/{user_name}/games/2021/{str(month_index + 1).zfill(2)}"
        print(api)
        results = requests.get(api).json()

        for next_game in results['games']:
            if next_game['time_class'] == 'rapid':
                output_file.write(next_game['pgn'])
                output_file.write("\n\n")
As you can see, I filtered my games to just rapid games, since that is what I was interested in.
Step 2 - Calculating Centipawn Loss
Now I have all my games in one big file, but I need a way to calculate centipawn loss. As I mentioned above, Lichess will calculate this, but I figured I could do it all locally, and all at once.
I do have Chessbase, and that has a feature to calculate centipawn loss. This is the first feature of Chessbase that I’ve found that I actually use. Before this I was basically just using Chessbase as a storage mechanism, which is a bit silly for the price. Lichess studies could do the same thing. But now I am starting to see some value in Chessbase.
I first added the generated PGN file to Chessbase. I converted it to Chessbase’s CBH format, but I’m not sure if I needed to do that. In the end I converted it back to PGN anyway.
Once in Chessbase, I used the Centipawn analysis feature. I selected all my games, clicked the button, and let it run overnight. I’m not sure exactly how long it took. For the setting, I used 3 seconds, which seemed like sufficient.
Step 3 - Getting The Data Out of Chessbase
This admittedly was a bit difficult. Chessbase wrote out some text files after the generation. The files have each player and a list of centipawn loss averages.
For example, for one opponent I played three times it wrote:
Some Opponent: 93/91/56 => Average=0.82
For me, who played in every game, it started like:
MattPlaysChess: 187/204/167/123/123/116/176/146/133/137/152...
And went on and on for 600+ games. I could extract that, but they did not seem to actually be in order of the games. That would not work for me since I wanted to graph the results by date. I needed the date and centipawn loss for each game so I could sort it.
The other thing Chessbase did was to add a comment with the centipawn loss to each game. The final move had a comment with statistics including a line like Centipawn loss: w=98/b=178.
My solution was to just export all the games, parse the PGN, and then output the date and centipawn loss. If you need to export files as PGN from Chessbase, it seems like the way you need to do that is to create a new database in PGN format (not CBH), and then copy games to that. Now I had a new big PGN file with all my games, but now they were annotated with centipawn loss.
Step 4 - Parse The Data
Now I used a script again to go through each PGN file and pull out the information I needed for my chart. Basically just the date and the centipawn loss for my player (first figuring out if I was white or black).
import chess.pgn
pgn = open("chessbase-export.pgn", encoding="utf-8")

username = "MattPlaysChess"
centipawn_keyword = "Centipawn loss:"

# Read the first game
game = chess.pgn.read_game(pgn)
while game is not None:
    # do this for each game
    player_color = chess.WHITE # Default
    found_player = False # Just in case there is a game not played by this username
    if game.headers["White"] == username:
        player_color = chess.WHITE
        found_player = True
    elif game.headers["Black"] == username:
       player_color = chess.BLACK
       found_player = True

    if found_player:
        date = game.headers["Date"]

        # get to the last move
        for next_move in game.mainline():
            if next_move.is_end() and next_move.comment != None:
                oneline_comment = ' '.join([line.strip() for line in next_move.comment.split('\n')])
                # print(oneline_comment)
                cp_index = oneline_comment.find(centipawn_keyword)
                if cp_index != -1:
                    cp = oneline_comment[cp_index + len(centipawn_keyword) + 1:]
                    cp_value = 0
                    if player_color == chess.WHITE:
                        cp_value = cp[2:cp.find("/")]
                    else:
                        cp_value = cp[cp.find("/") + 3:]

                print(f"{date},{cp_value}")

    # Read the next game
    game = chess.pgn.read_game(pgn)
This just prints out the date and centipawn loss for my user. There are a few cases where there was no centipawn loss calculated, especially if there were not enough moves. You may need to clean up the output a bit. There were a few parsing issues that I just cleaned up manually instead of really worrying about making the script super robust. For example, some of the centipawn output was =80 instead of just 80 because of how the lines wrapped. Easy enough to clean up. I also had to clean up the date format from 2021.04.30 to 2021-04-30 for the spreadsheet to understand it. I could have easily done that in the script, but a quick find/replace worked just as well.
Results
Once I had all the data, I just dropped it into a spreadsheet and created a chart with a trend line.

For me, I started the year with an average loss across my games of 96. By the end of the year the average was 63. I’m pretty happy about that. It shows improvement! It also looks like there was a bit less variation from the beginning of the year to the end. I’m sure I could calculate that, but just seeing it visually is enough for now. There are still some big spikes, and I remember some of those games as being tough.
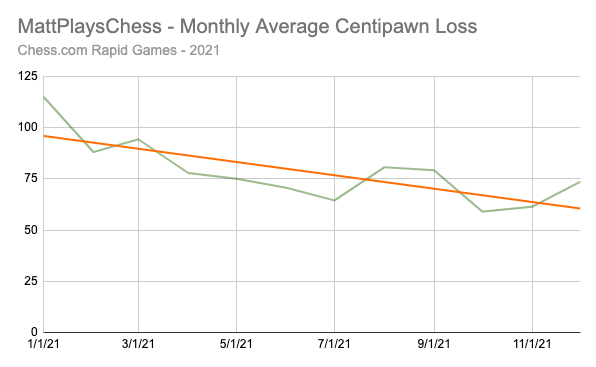
I also took the monthly average and made a chart of that:

This more aligns with how I felt this year. The start of the year showed steady improvement. Then the second half of the year was more up and down.
Overall I am happy with the trends. I may continue to track this value over time and see how I am progressing.
I hope this was helpful to you!